MediaAttention.
Open source · Apache-2.0 · by Pratyush Mahapatra

See your ad the way people will

MediaAttention predicts where viewers look in an image or video ad, then scores it for focus, complexity, memorability and attention on your brand, product and call to action. Before a single impression is bought.

~2 sper image on an M3 laptop
30 sfor a 10-second video
0uploads; creatives stay local
ad.png · interactive
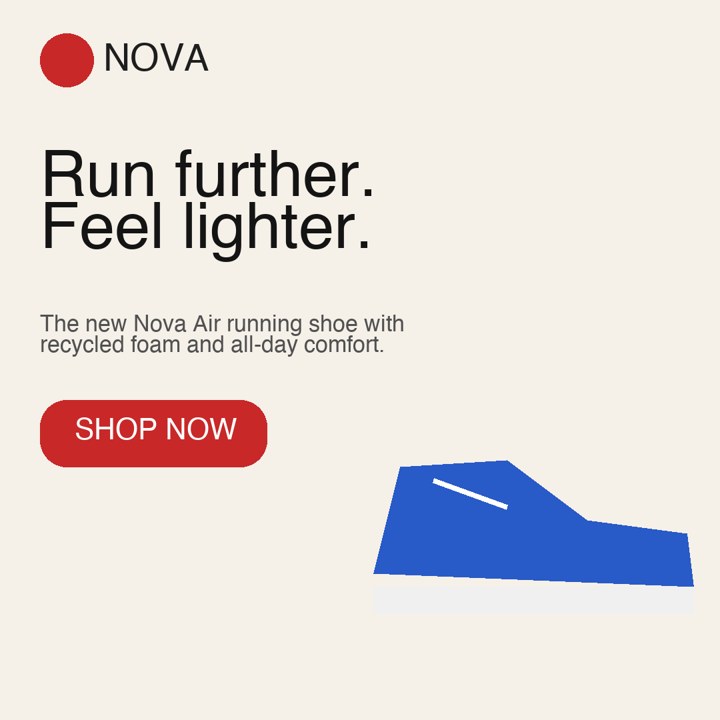
Example ad: NOVA running shoe with headline, body copy and a Shop Now button
Move here: you are the eye tracker

Where did your eye go first? Wave across the ad to clear the fog, then compare with the model's prediction.

Why attention

Attention is the first gate in advertising. The brand, the product and the message have to be looked at before they can persuade or be remembered. Decades of eye-tracking research show attention can be predicted, and that small design choices move it a lot.

Pieters & Wedel, 2004 [17]

Size and placement steer the eye

In magazine-ad eye tracking, pictures capture attention regardless of size, text gains in proportion to its surface, and attention on the brand transfers to the rest of the ad.

Milosavljevic et al., 2012 [19]

Saliency biases choice

When people decide quickly, products that are simply more visually salient get chosen more often, even over ones they prefer.

Pieters, Wedel & Batra, 2010 [18]

Complexity cuts both ways

Varied, well-organised design helps an ad stop people and get liked; dense, cluttered detail hurts both.

What is what

Seven outputs, each with a job. For every metric: what it measures, how MediaAttention computes it, and what to do about it. The formulas are in the code and the README.

01 · pixel map

Heatmap & fog

WHERE PEOPLE LOOK
What
Where viewers are predicted to fixate in the first seconds of free viewing. The fog map is the inverse: whatever stays fogged is likely missed.
How
UNISAL [26], a compact network trained on human fixations (SALICON [4]), picked by our eye-tracking benchmark as the most accurate model with an open licence. DeepGaze IIE [1] is an optional, more accurate and slower alternative.
Do
If your logo or offer sits in fog, move it, enlarge it or give it contrast.
02 · 0–100, higher is sharper

Focus

CONCENTRATED OR SCATTERED
What
Whether attention lands on a few elements or scatters across the frame.
How
The share of the image needed to hold 80% of predicted attention, inverted to 0–100: attention dispersion, as used in TV-ad eye tracking [20].
Do
Low focus means competing elements. Cut one, or build a clearer visual hierarchy.
03 · 0–100, moderate is best

Cognitive demand

HOW MUCH THERE IS TO PROCESS
What
How much visual information a viewer has to take in.
How
Mean Shannon entropy [15] of local 16×16 blocks, a simple clutter measure in the spirit of [16]. Per frame for video.
Do
Too high: simplify copy and background. Too low: there may be nothing to hold the eye.
04 · % of attention, lift ×

AOI attention & lift

BRAND · PRODUCT · HEADLINE · BODY · CTA
What
The share of attention on each element, plus lift: attention share ÷ area share.
How
Text roles come from OCR (PP-OCR models via RapidOCR [9]) and layout rules; logo and product from open-vocabulary detection with OWLv2 [8].
Do
Brand under ~5% of attention is a branding risk. A CTA with lift under 1 is being overlooked.
05 · 0–100, optional

Memory

WILL THEY RECOGNISE IT
What
The predicted share of viewers who would recognise the creative after a brief exposure.
How
ResMem [10], trained on the LaMem [11] and MemCat [13] recognition datasets, building on the memorability work of [12].
Do
Compare variants against each other within your corpus; absolute values cluster high.
06 · 1–10, ≥7 ready

Impact score

ONE PRE-FLIGHT NUMBER
What
A roll-up of the metrics that matter for the creative.
How
Each metric scores 10 inside its target range and drops linearly outside; the impact score is the mean. Targets come from your own ads.
Do
≥7 launch · 3.5–6.9 optimise · ≤3.4 rework. Read the per-metric scores to see why.
07 · per frame, timeline

Video: cuts, openings, endings & tracking

EVERYTHING ABOVE, OVER TIME
What
Every metric over time; hard cuts; focus and memory in the first and last two seconds; attention on each AOI overall, while it's on screen, and how long it's visible.
How
Frames decoded with PyAV, cuts found from histogram jumps, attention smoothed over the last second so it lingers after a cut like real gaze. AOIs are detected at each shot start and tracked with pyramidal Lucas–Kanade optical flow [21, 22, 23].
Do
Don't land the brand or offer right after a hard cut; memory dips there (the "doorway effect" [24]). Make sure the brand is on screen early and long enough.
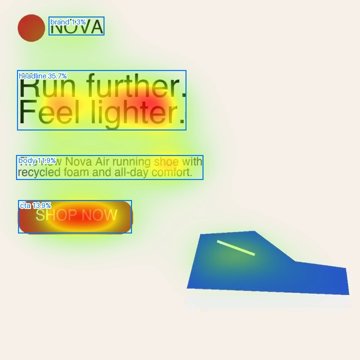
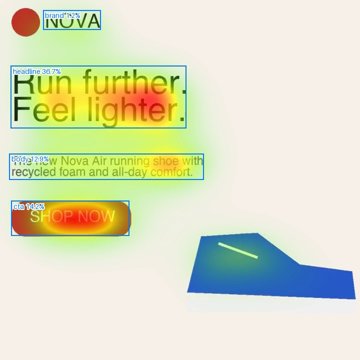
ad.png · AOIs
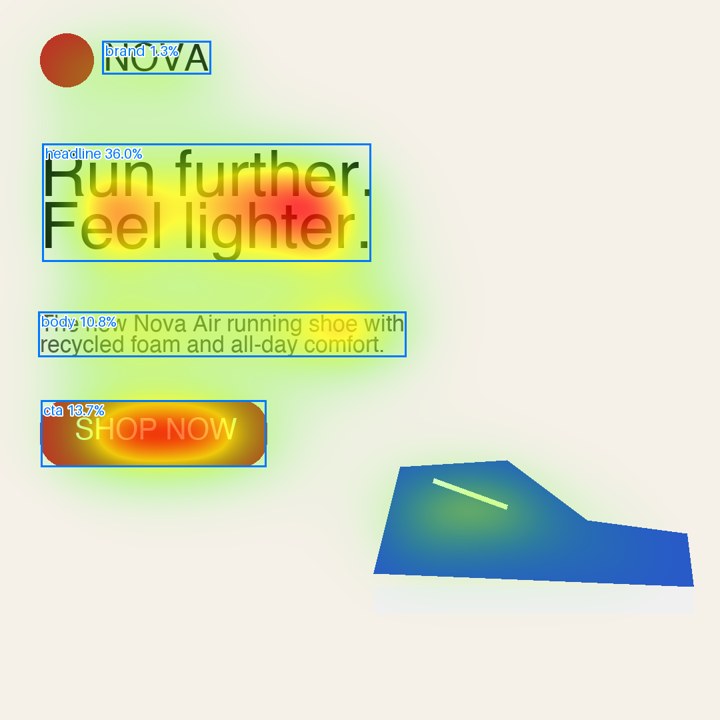
Predicted heatmap on the example ad with boxes around the brand, headline, body copy and CTA
scores.json
6.7/ 10 · optimise: the brand is barely seen
AOIAttentionAreaLift
Headline36.0%7.5%4.8×
CTA13.7%2.9%4.7×
Body copy10.8%3.2%3.4×
Brand1.3%0.7%1.8×

The headline takes over a third of all attention while the NOVA logo gets 1.3%, so the brand score is 1.8/10 and the ad lands in "optimise". The fix is a bigger wordmark near the headline, not more copy.

How it's built

Openly published models stitched together with transparent maths. Each stage is small enough to read in one sitting and swap out when something better appears.

  1. attention

    Predict attention

    A fixation-density map for the whole frame, calibrated to how people actually look.

    UNISAL [26] · DeepGaze IIE [1] · spectral residual [3]
  2. layout

    Read the layout

    OCR finds every text line; size and button-shaped patches sort them into headline, body and CTA.

    RapidOCR / PP-OCR [9]
  3. objects

    Find brand & product

    Open-vocabulary detection scores each role separately, so the logo can't steal the button's box.

    OWLv2 [8]
  4. metrics

    Score

    Focus, cognitive demand and AOI attention are numpy over the heatmap; memory is a separate network.

    numpy · ResMem [10]
  5. video

    Follow video

    Decode every frame, detect cuts, smooth attention over one second, track AOIs within each shot.

    PyAV · OpenCV LK flow [21–23]
  6. bench

    Calibrate

    Score your own ads; each target becomes the top 20% (middle 50% for complexity).

    percentiles per category
  7. impact

    Roll up

    Per-metric 1–10 scores against those targets, averaged, skipping what's absent.

    impact_score()
  8. outputs

    Show it

    Heatmap, fog and AOI overlays, a heatmap video, a timeline, JSON and a local web UI.

    Pillow · Gradio [25]
attention model · UNISAL (Droste et al., ECCV 2020)
Input image / frameRGB on a 32-px grid · ImageNet-normalisedMobileNetV2 encoder2.2M params · features at 1/8, 1/16, 1/32⊕ 16 Gaussian prior mapslearned 'where people look' priors1×1 conv + BN → 256 chpost-encoder projectionBypass-RNN · ConvGRUvideo only · state carried across framesDecoder ↑×2, ↑×2inverted-residual blocks + skipsDomain adaptation + 41×41 smoothingSALICON branch for images, DHF1K for videolog-softmax → fixation densitysums to 1 over the image+ residualskips: 1/16 (160→128 ch), 1/8 (64 ch)3.7M parameters in total
how to read it

One network, images and video

  • Encoder: a MobileNetV2 reads the ad at three scales. Sixteen learned Gaussian maps add a prior for where people tend to look first.
  • Bypass-RNN: for video, a ConvGRU carries attention from frame to frame, so it lingers after a cut like real gaze. For still images it is skipped.
  • Decoder: upsamples twice, mixing in finer encoder features through skip connections, so small text and buttons stay sharp.
  • Domain heads: batch norm, adaptation and a learned 41×41 smoothing kernel are specific to each training set: SALICON for images, DHF1K for video.
  • Output: a log-softmax over pixels, a probability map of where the next fixation lands.
ad.mp4 · two shots, cut at 3.0 s
Shot one at 0.5 seconds
0.5 s
Shot one at 2.0 seconds, boxes following the zoom
2.0 s · boxes follow the zoom
Shot two at 3.5 seconds, AOIs re-detected
3.5 s · new shot, AOIs re-detected
Shot two at 5.0 seconds
5.0 s
MemoryFocusCognitive demand┆ hard cut

Your own best work

Generic targets lie: a luxury OOH poster and a TikTok ad shouldn't chase the same complexity. Point bench at 30+ ads from one category, and every metric's target becomes the band your top performers hit.

step 1

Collect

One folder per category: FMCG social, auto OOH, fintech display…

step 2

Bench

From the command line or the web UI's Calibrate tab. You get benchmarks.json plus per-asset scores.

step 3

Score new work

Pass the targets with --benchmarks, or let the UI load them automatically.

Get started

Python 3.10+. Runs on CPU, NVIDIA GPUs and Apple Silicon. Model weights download on first use.

install

Install

$ pip install "mediaattention[all]"
# optional, non-commercial
$ pip install "mediaattention[memory]"
web ui

Web UI

$ mediaattention ui
# http://localhost:7860
# Analyse: drop an ad
# Calibrate: drop a batch
cli

Command line

$ mediaattention ad.png --aoi auto \
    --product "a running shoe"
$ mediaattention spot.mp4 --aoi auto
$ mediaattention bench ads/fmcg/ \
    --aoi auto --out bench/

Your own panel

Every commercial tool rests on a private panel. MediaAttention ships the panel kit: a browser study you send to anyone, with no server and no uploads. Webcam eye tracking, gut-reaction word tests and a memory test give you real attention, engagement, trust and memory data on your own ads.

1 · describe

Write study.json

The ads, a few unseen "foil" ads for the memory test, and the words to react to: Engaging, Trustworthy, Boring…

2 · share

Send one link

Participants calibrate with 9 clicks, watch each ad for 5 s, then answer Yes/No with F and J, timed in milliseconds. They download a results file at the end.

3 · import

Get real data

mediaattention collect turns the files into an eye-tracking dataset to score models against, plus per-ad engagement, trust, avoidance, intent and memory scores for bench --kpi.

where the data lives

Nowhere central: there is no server and no database. During the study, results exist only in the participant's browser tab. Webcam frames are processed on the spot and discarded, so no video or image of anyone is ever stored or sent.

At the end, the participant downloads one results file (gaze coordinates, answers and reaction times; no name, email or IP, just a random ID) to their own device. They choose whether to send it to you, and you import it locally. The study page itself is static: nothing flows back to it.

Gaze comes from MediaPipe face landmarks (Apache-2.0) and a per-person calibration. Expect 2–4° of error, which is fine for heatmaps across many people. Try the study with your webcam, or without a camera (your mouse stands in for your eyes).

Honest limits

Predictions are a fast first filter, not a substitute for testing with real people when the stakes are high.

  • Trained on natural images, not ads. The attention model learned from public eye-tracking datasets and can be less sharp on text-heavy creatives.
  • No emotion scores yet. Engagement, trust and intent need human response data that hasn't been released openly. They're on the roadmap, not faked.
  • Layout rules, not a layout model. A headline smaller than its body copy, a ghost button or a centred logo can fool AOI detection; pass your own boxes then.
  • Targets are only as good as your corpus. bench ranks ads by their own scores; rank by real KPIs (CTR, recall) when you have them.
  • Memory scores cluster high, and ResMem's weights are non-commercial, which is why it's an optional extra.
  • Check model licences. The default model, UNISAL, is Apache-2.0. The optional DeepGaze IIE's repository has no licence file (all rights reserved by default) and ResMem is non-commercial. Both are downloaded from their authors at runtime, never redistributed here.
  • Video has no audio. Sound, voice-over and music drive attention in video and aren't modelled.

Research & credits

MediaAttention exists because these researchers published their methods, data and models. If you use it in your work, please cite the papers behind the parts you rely on. The research report reviews 15 commercial tools and benchmarks six open models against human eye tracking.

attention & saliency
  1. Linardos, A., Kümmerer, M., Press, O. & Bethge, M. (2021). DeepGaze IIE: Calibrated prediction in and out-of-domain for state-of-the-art saliency modeling. ICCV. arXiv:2105.12441used: attention heatmap
  2. Kümmerer, M., Wallis, T. S. A. & Bethge, M. (2018). Saliency benchmarking made easy: Separating models, maps and metrics. ECCV. arXiv:1704.08615used: evaluation methodology
  3. Hou, X. & Zhang, L. (2007). Saliency detection: A spectral residual approach. CVPR. doiused: lightweight fallback model
  4. Jiang, M., Huang, S., Duan, J. & Zhao, Q. (2015). SALICON: Saliency in context. CVPR. doitraining data behind DeepGaze IIE
  5. Judd, T., Ehinger, K., Durand, F. & Torralba, A. (2009). Learning to predict where humans look. ICCV. doitraining data behind DeepGaze IIE
  6. Bylinskii, Z., Judd, T., Oliva, A., Torralba, A. & Durand, F. (2019). What do different evaluation metrics tell us about saliency models? IEEE TPAMI 41(3). arXiv:1604.03605used: metric choice (CC, SIM, KLD)
  7. Tatler, B. W. (2007). The central fixation bias in scene viewing: Selecting an optimal viewing position independently of motor biases and image feature distributions. Journal of Vision 7(14). doiused: centre-bias prior
  8. Droste, R., Jiao, J. & Noble, J. A. (2020). Unified image and video saliency modeling. ECCV. arXiv:2003.05477used: attention heatmap (default model)
layout, text & objects · memorability
  1. Minderer, M., Gritsenko, A. & Houlsby, N. (2023). Scaling open-vocabulary object detection (OWLv2). NeurIPS. arXiv:2306.09683used: logo & product detection
  2. Du, Y. et al. (2020). PP-OCR: A practical ultra lightweight OCR system. arXiv:2009.09941used: text detection (via RapidOCR)
  3. Needell, C. D. & Bainbridge, W. A. (2022). Embracing new techniques in deep learning for estimating image memorability. Computational Brain & Behavior 5. doiused: memory score (ResMem)
  4. Khosla, A., Raju, A. S., Torralba, A. & Oliva, A. (2015). Understanding and predicting image memorability at a large scale (LaMem). ICCV. doitraining data behind ResMem
  5. Isola, P., Xiao, J., Torralba, A. & Oliva, A. (2011). What makes an image memorable? CVPR. doibackground: the memory game protocol
  6. Goetschalckx, L. & Wagemans, J. (2019). MemCat: a new category-based image set quantified on memorability. PeerJ 7. doitraining data behind ResMem
complexity & advertising science
  1. Itti, L., Koch, C. & Niebur, E. (1998). A model of saliency-based visual attention for rapid scene analysis. IEEE TPAMI 20(11). doibackground: computational saliency
  2. Shannon, C. E. (1948). A mathematical theory of communication. Bell System Technical Journal 27. doiused: cognitive demand (entropy)
  3. Rosenholtz, R., Li, Y. & Nakano, L. (2007). Measuring visual clutter. Journal of Vision 7(2). doibackground: clutter as a load measure
  4. Pieters, R. & Wedel, M. (2004). Attention capture and transfer in advertising: Brand, pictorial, and text-size effects. Journal of Marketing 68(2). doiused: why AOI attention matters
  5. Pieters, R., Wedel, M. & Batra, R. (2010). The stopping power of advertising: Measures and effects of visual complexity. Journal of Marketing 74(5). doiused: two-sided complexity target
  6. Milosavljevic, M., Navalpakkam, V., Koch, C. & Rangel, A. (2012). Relative visual saliency differences induce sizable bias in consumer choice. Journal of Consumer Psychology 22(1). doibackground: saliency drives choice
  7. Teixeira, T., Wedel, M. & Pieters, R. (2010). Moment-to-moment optimal branding in TV commercials: Preventing avoidance by pulsing. Marketing Science 29(5). doiused: attention dispersion (focus)
video & tooling
  1. Lucas, B. D. & Kanade, T. (1981). An iterative image registration technique with an application to stereo vision. IJCAI.used: AOI tracking
  2. Shi, J. & Tomasi, C. (1994). Good features to track. CVPR. doiused: tracking points
  3. Bouguet, J.-Y. (2000). Pyramidal implementation of the Lucas–Kanade feature tracker. Intel Corporation.used: pyramidal flow (OpenCV)
  4. Radvansky, G. A., Krawietz, S. A. & Tamplin, A. K. (2011). Walking through doorways causes forgetting: Further explorations. Quarterly Journal of Experimental Psychology 64(8). doiused: cut guidance
  5. Abid, A. et al. (2019). Gradio: Hassle-free sharing and testing of ML models in the wild. arXiv:1906.02569used: web UI

Also built on PyTorch, OpenCV, PyAV, Hugging Face Transformers, RapidOCR, NumPy, SciPy and Pillow. Model weights keep their own licences; ResMem is non-commercial.